Statistical Thinking for Machine Learning: Lecture 3
Reda Mastouri
UChicago MastersTrack: Coursera
Thank you to Gregory Bernstein for parts of these slides
Recap
Recap
Understanding data and different data types
Recap
Understanding data and different data types
Distributions, PDF, CDF
Recap
Understanding data and different data types
Distributions, PDF, CDF
Sampling and descriptive statistics
Recap
Understanding data and different data types
Distributions, PDF, CDF
Sampling and descriptive statistics
Hypothesis testing to evaluate a single parameter
Recap
Understanding data and different data types
Distributions, PDF, CDF
Sampling and descriptive statistics
Hypothesis testing to evaluate a single parameter
Bivariate linear model
Recap
Understanding data and different data types
Distributions, PDF, CDF
Sampling and descriptive statistics
Hypothesis testing to evaluate a single parameter
Bivariate linear model
Correlation vs. Causation
Agenda
Agenda
- Multivariate linear regression
- Model evaluation
- Omitted variable bias
- Multicollinearity — correlated independent variable
Agenda
Multivariate linear regression
- Model evaluation
- Omitted variable bias
- Multicollinearity — correlated independent variable
Hypothesis testing
- Testing multiple parameters — T test vs. F test
Agenda
Multivariate linear regression
- Model evaluation
- Omitted variable bias
- Multicollinearity — correlated independent variable
Hypothesis testing
- Testing multiple parameters — T test vs. F test
Variable transformations — interpreting results
- Affine
- Polynomial
- Logarithmic
- Dummy variables
Multivariate Regression
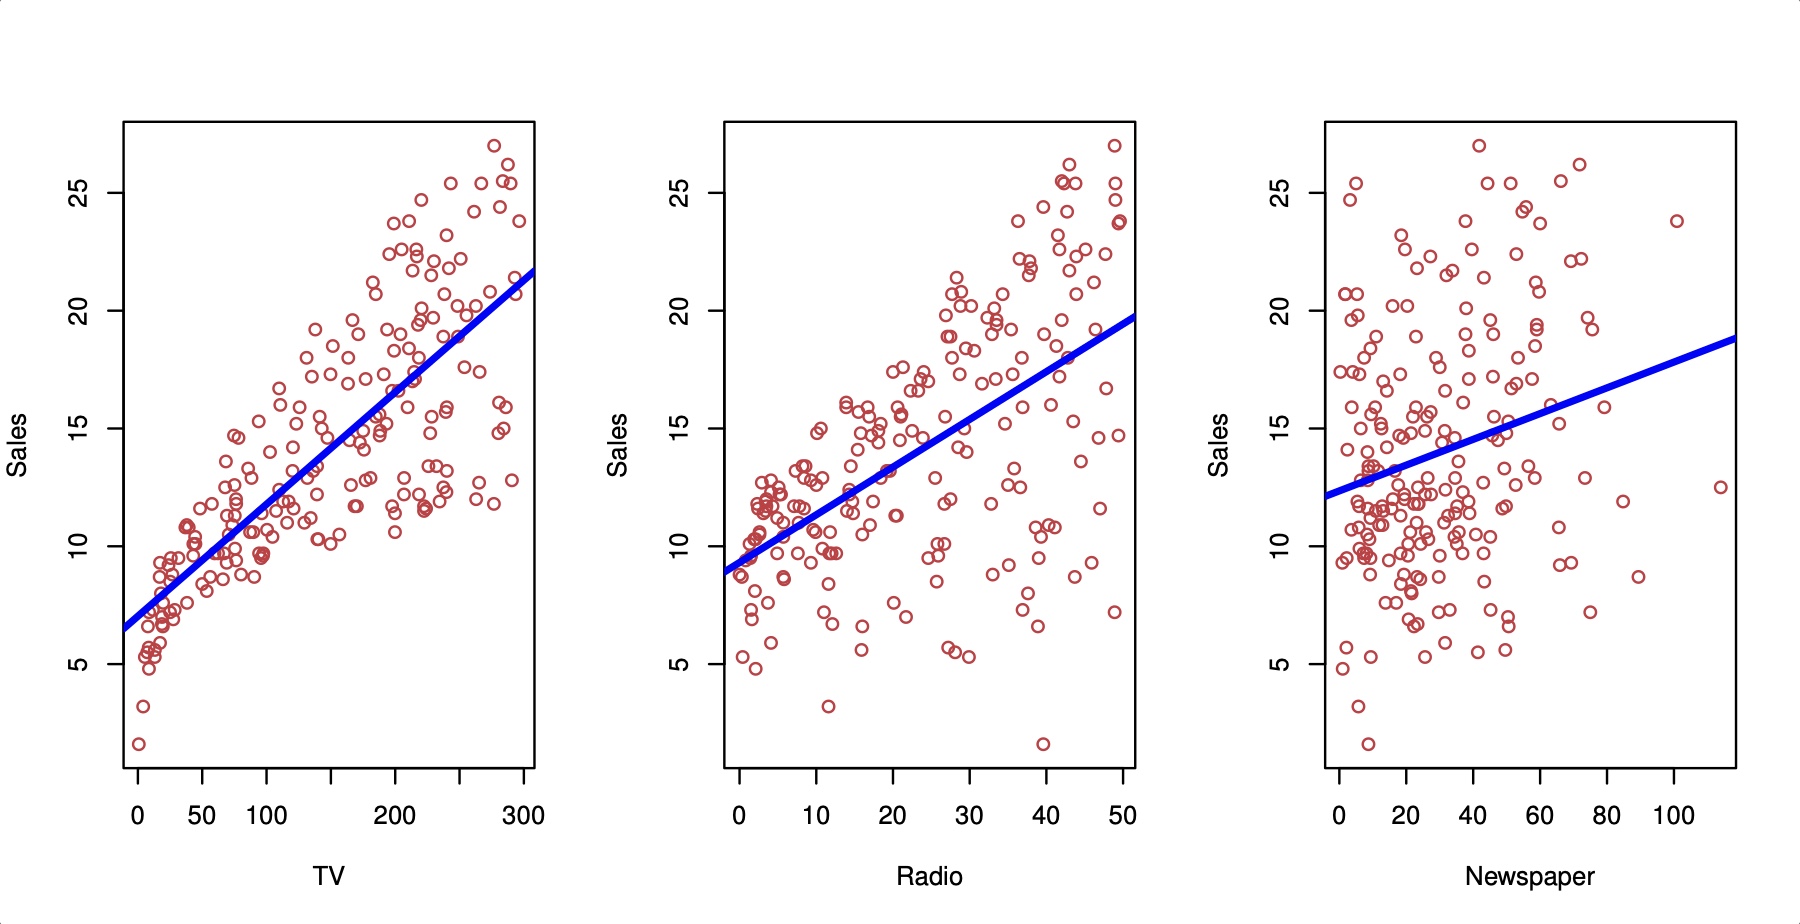
Simple Regression

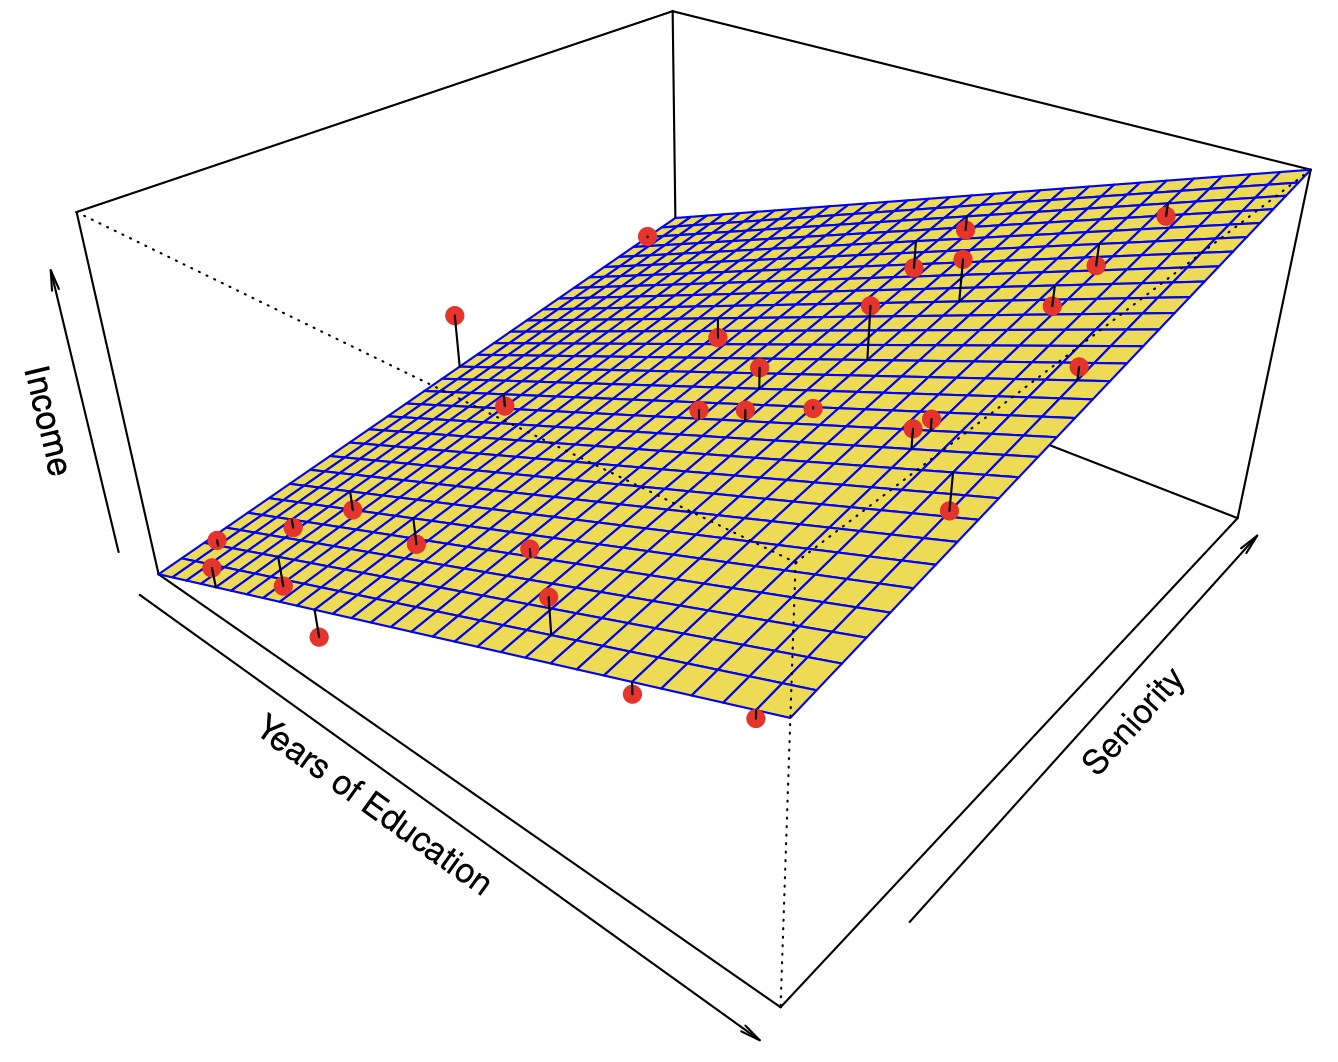
Multivariate Regression

Multivariate Regression
y=β1+β1x1+β2x2+ϵ
How do we interpret β1, β2?
- y=10+3x1+4x2, x1=5, x2=3
- y=10+18+20=48
- 1 unit increase in x1 led to a β1 increase in y (just like bivariate regression)
- But what about x2? It did not change. So this change is only true holding x2 constant
- We can hold x2 constant to see how y changes as x1 changes at that level of x2
Evaluating the Model: Adjusted R2
- Recall we can use R2=1−SSR/TSS
- When we add a new independent variable, TSS does not change. TSS=(u−mean(y))2
- However, the new variable will always cause SSR, (y−^y)2 to decrease. Therefore, R2 will always decrease, which makes adding more variables ostensibly better
- Adjusted R2 adds a disincentive (penalty) for adding new variables: Adj R2=1−(n−1)n−k−1SSRTSS
Omitted variable bias
- If we do not use multiple regression, we may get biased estimate of the variable we do include
- "The bias results in the model attributing the effect of the missing variables to the estimated effects of the included variable."
- In other words, there are two variables that determine y, but our model only knows about one.
- The model we estimate with one variable accounts for the full effect of y, when we know the effect should be split between the two variables
Omitted variable bias
- When will there be no omitted variable bias effect?
- The second variable has no effect on y. Therefore, there is no extra effect to go into the first variable
- x1 and x2 are completely unrelated. Even though x2 has an effect on y, x1 lacks that information
^β1=^Cov(X,Y)^Var(X)
^Cov(educ,wages)=^Cov(educ,β1educ+β2exp+ϵ)=β1^Var(educ)+β2^Cov(educ,exp)+^Cov(educ,ϵ)=β1^Var(educ)+β2^Cov(educ,exp)
Omitted variable bias: ^β1=β1+β2^Cov(educ,exp)^Var(educ)
Calculating the bias effect
Population model (true relationship): y=β0+β1x1+β2x2+ν
Our model: y=^β0+^β1x1+υ
Auxiliary model: x2=δ0+δ1x1+ϵ
- In the simple case of one regression and one omitted variable, estimating equation (2) by OLS will yield:
E(^β1)=β1+β2δ
Equivalently, the bias is: E(^β1)−β1=β2δ
| A and B are positively correlated |
A and B are negatively correlated |
|
|---|---|---|
| B is positively correlated with y |
Positive bias | Negative bias |
| B is negatively correlated with y |
Negative bias | Positive bias |
Example: Bostom Housing Data
| variable | description |
|---|---|
| CRIM | per capita crime rate by town |
| ZN | proportion of residential land zoned for lots over 25,000 sq.ft. |
| INDUS | proportion of non-retail business acres per town. |
| CHAS | Charles River dummy variable (1 if tract bounds river; 0 otherwise) |
| NO | nitric oxides concentration (parts per 10 million) |
| RM | average number of rooms per dwelling |
| AGE | proportion of owner-occupied units built prior to 1940 |
| DIS | weighted distances to five Boston employment centres |
| RAD | index of accessibility to radial highways |
| TAX | full value property tax rate per $10,000 |
| PTRATIO | pupil teacher ratio by town |
| B | 1000(Bk 0.63)^2 where Bk is the proportion of blacks by town |
| LSTAT | % lower status of the population |
| MEDV | Median value of owner-occupied homes in $1000's |

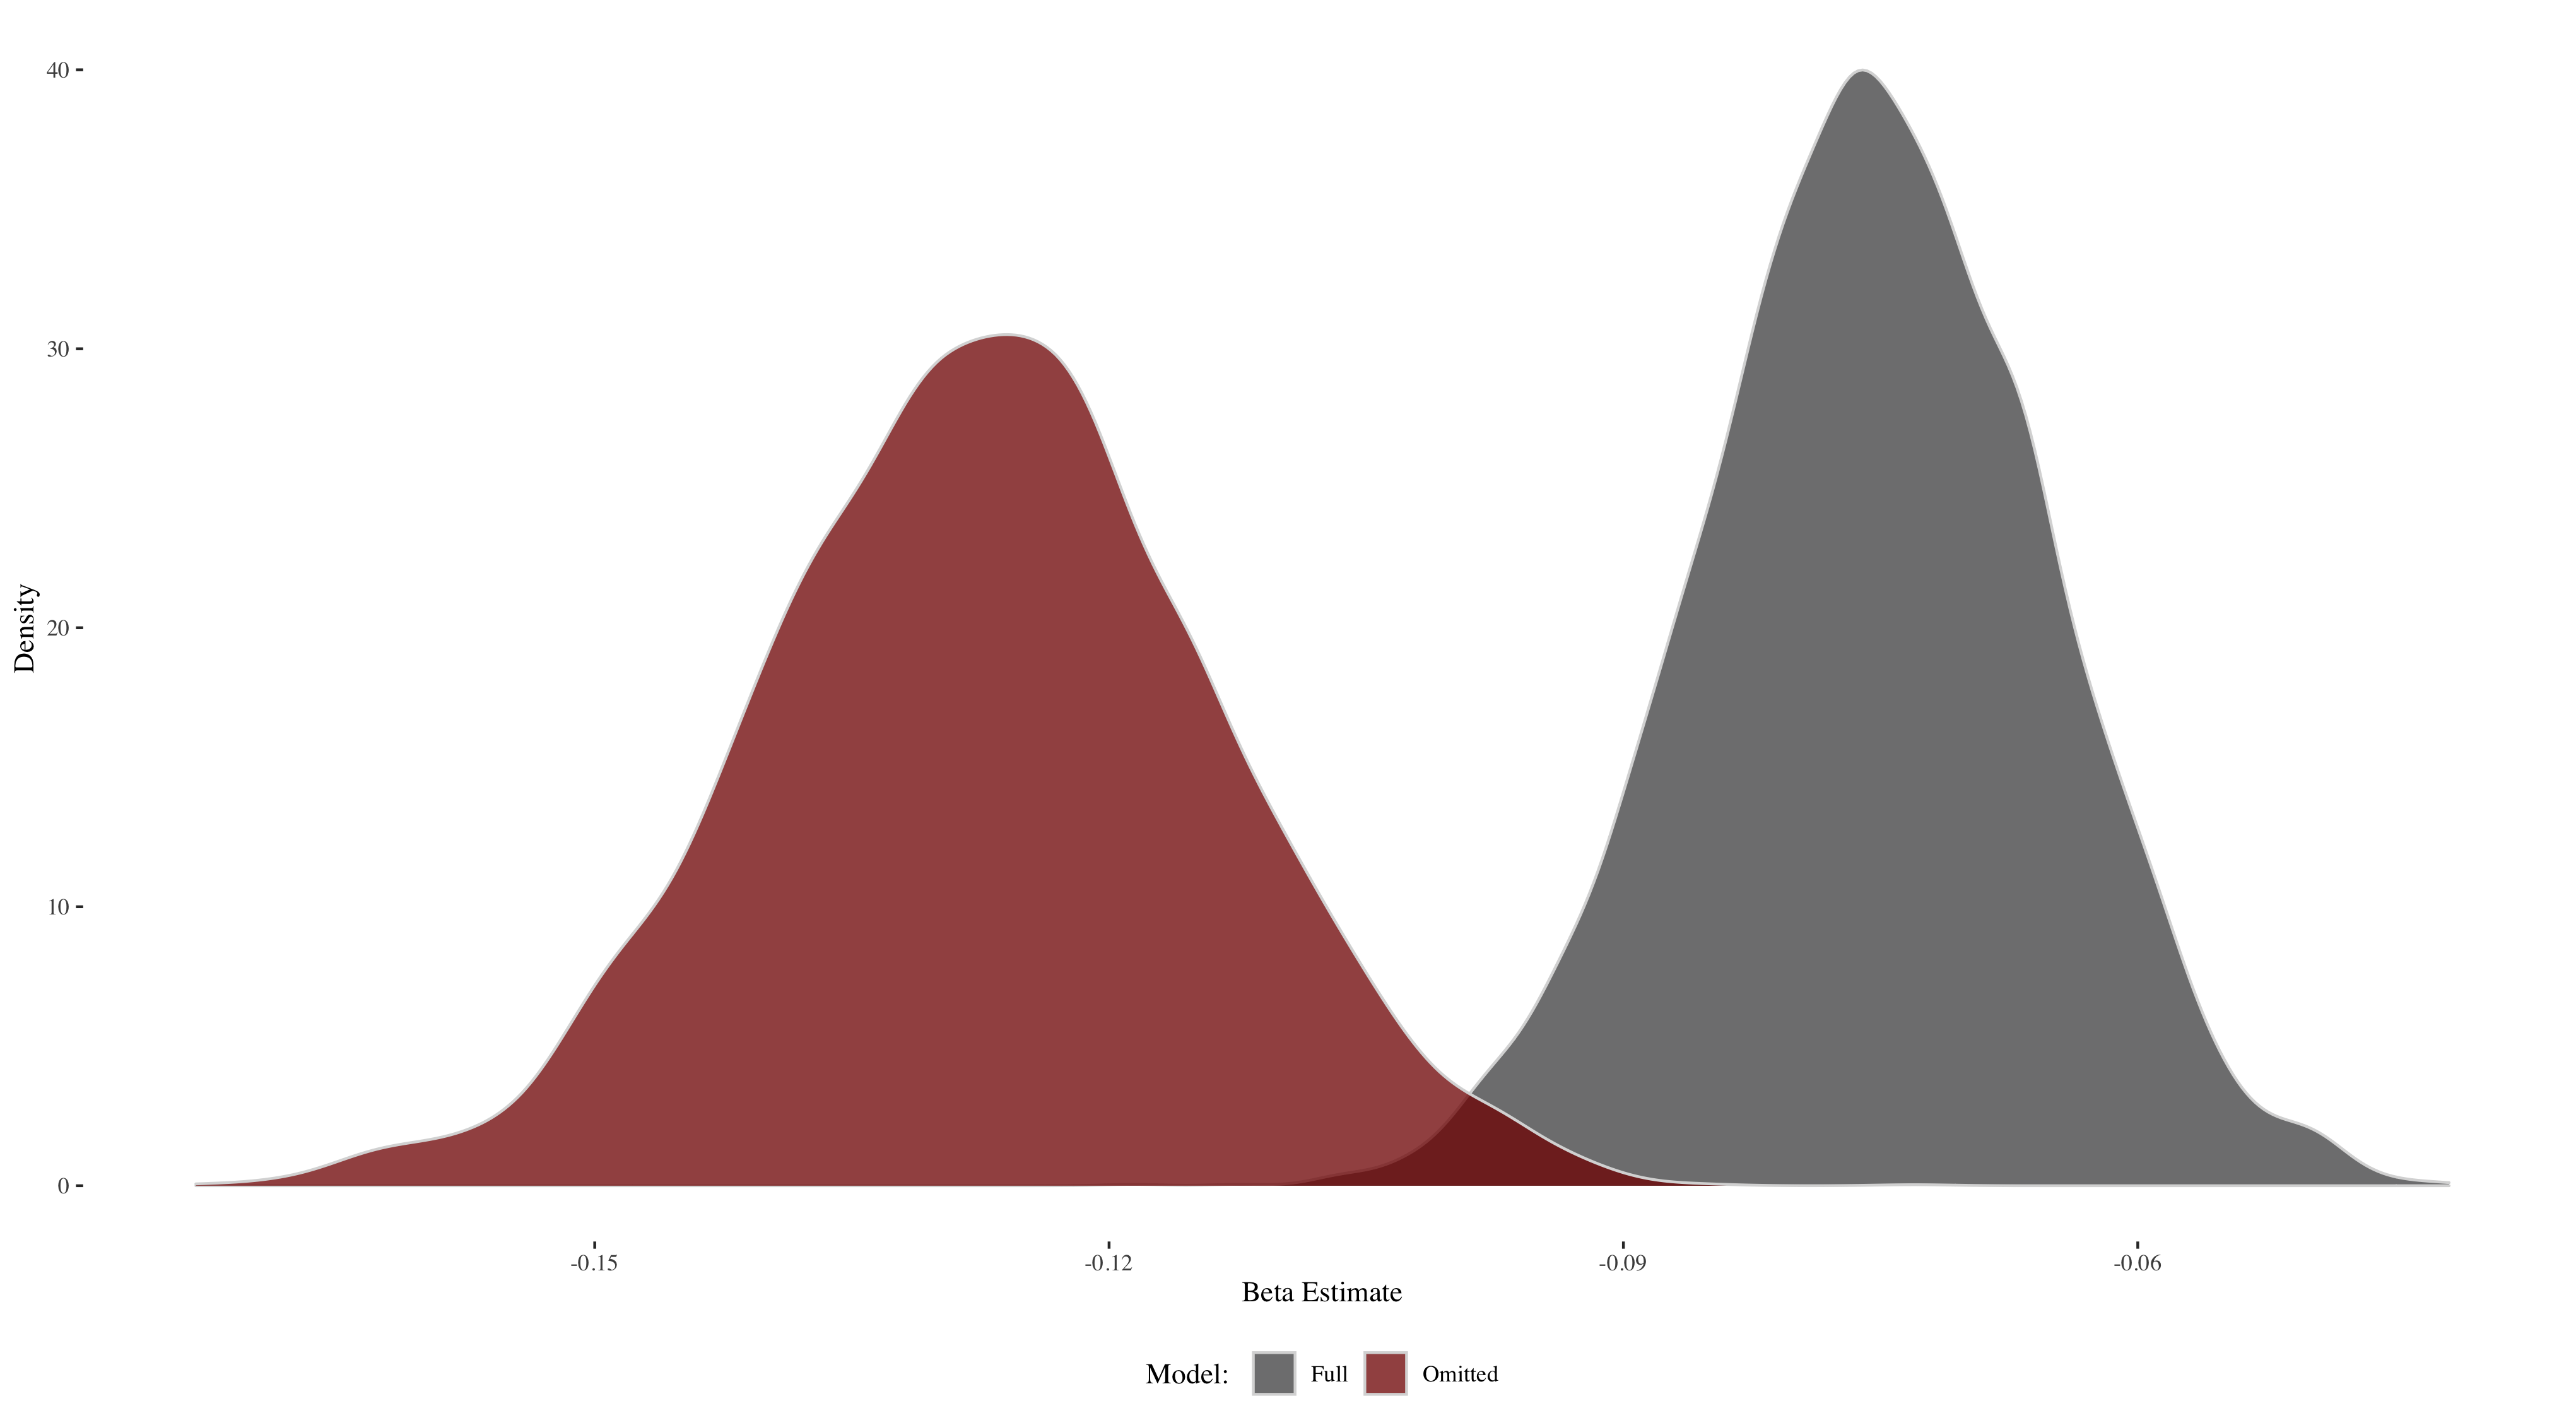
2,000 Regressions
- Take a random sample of 90% people out of the 506 that are in the Boston Housing data set
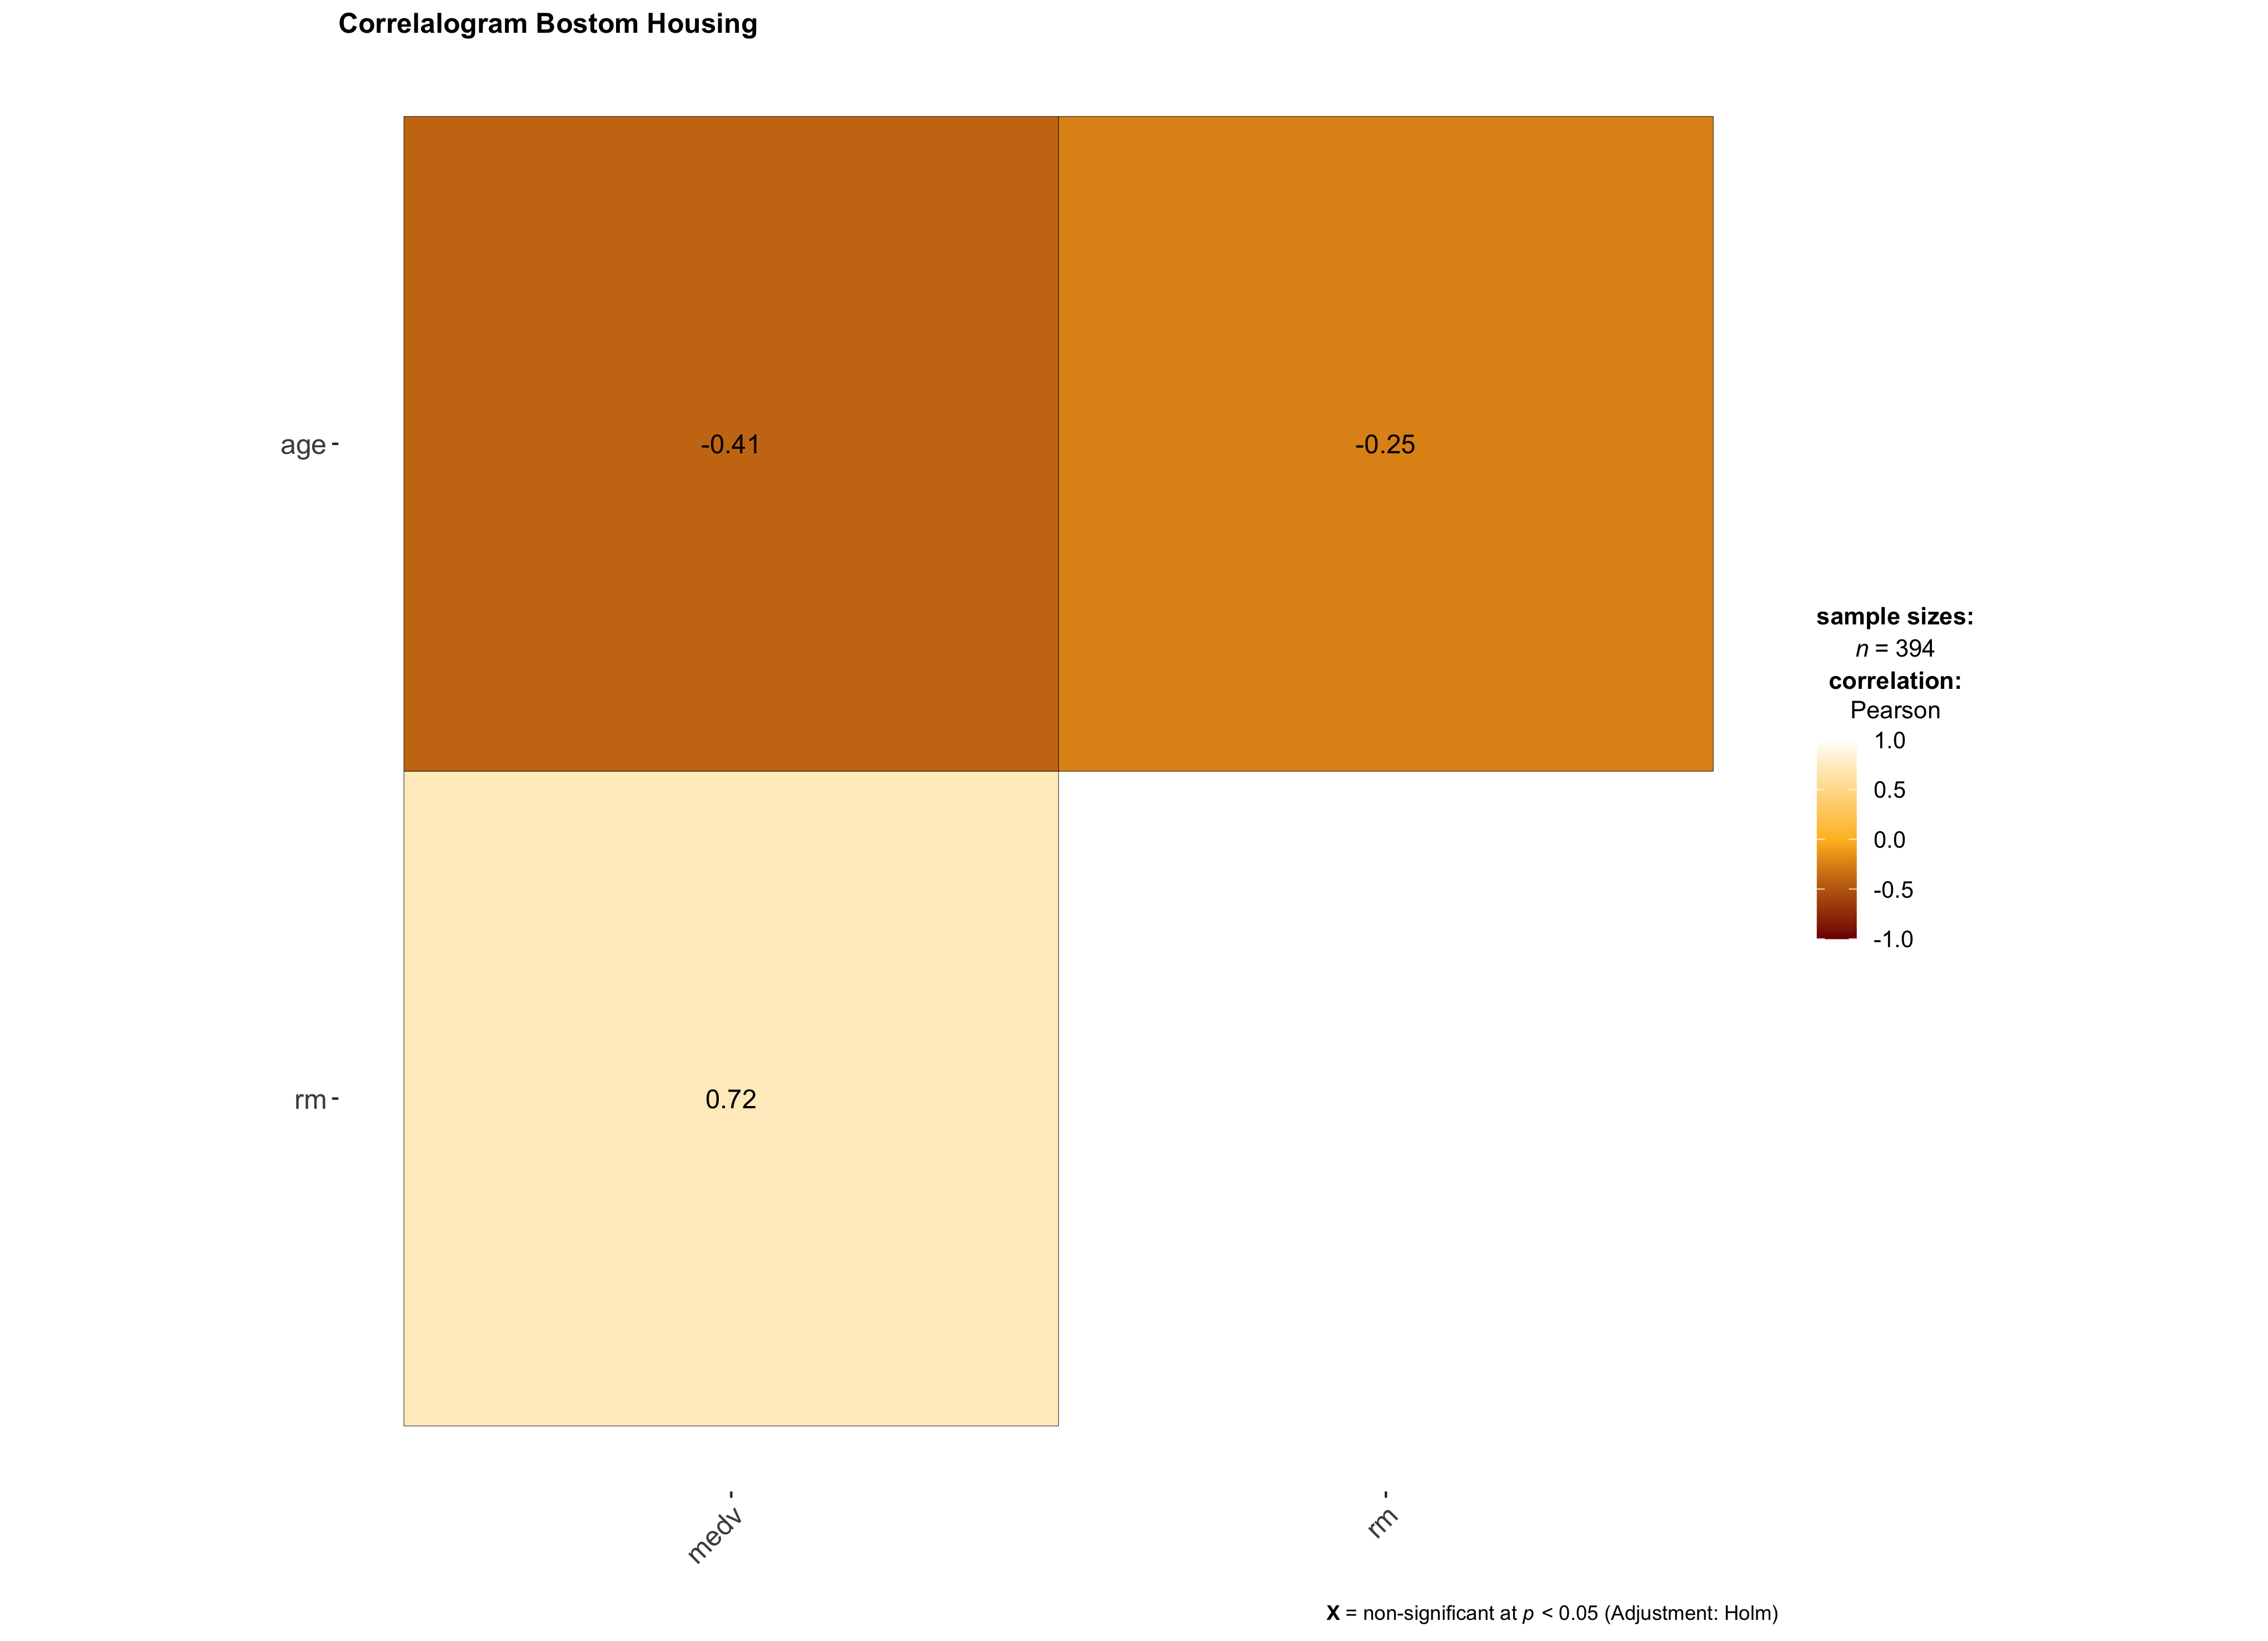
- Our model will be y=β1x1+β2x2+ϵ, where β1=age and β2=rm
- Estimate β1 using OLS (NOT controlling for rm) with the sample
- Estimate β1 using OLS, controlling for rm with the same sample
- Repeat 2,000 times
Our data:
| crim | zn | indus | chas | nox | rm | age | dis | rad | tax | ptratio | b | lstat | medv |
|---|---|---|---|---|---|---|---|---|---|---|---|---|---|
| 0.00632 | 18 | 2.31 | 0 | 0.538 | 6.575 | 65.2 | 4.0900 | 1 | 296 | 15.3 | 396.90 | 4.98 | 24.0 |
| 0.02731 | 0 | 7.07 | 0 | 0.469 | 6.421 | 78.9 | 4.9671 | 2 | 242 | 17.8 | 396.90 | 9.14 | 21.6 |
| 0.02729 | 0 | 7.07 | 0 | 0.469 | 7.185 | 61.1 | 4.9671 | 2 | 242 | 17.8 | 392.83 | 4.03 | 34.7 |
| 0.03237 | 0 | 2.18 | 0 | 0.458 | 6.998 | 45.8 | 6.0622 | 3 | 222 | 18.7 | 394.63 | 2.94 | 33.4 |
| 0.06905 | 0 | 2.18 | 0 | 0.458 | 7.147 | 54.2 | 6.0622 | 3 | 222 | 18.7 | 396.90 | NA | 36.2 |
| 0.02985 | 0 | 2.18 | 0 | 0.458 | 6.430 | 58.7 | 6.0622 | 3 | 222 | 18.7 | 394.12 | 5.21 | 28.7 |
β1 is underestimated when β2 is ommitted

Multicollinearity
Multicollinearity
- Multivariate linear models cannot handle perfect multicollinearity
- Example: we have two variables: x1 and x2=3×x1
- Fit model to predict y with x1 and x2:
- y=β0+β1x1+NA, where NA stands for not a value
- y=β0+β1x1+NA, where NA stands for not a value
- We can think of this as β1 containing the entire effect for both x1 and x2. After all, these variables are the same.
- Including highly correlated variables in our model will not produce biased estimates, but it will harm our precision.
Baseball example
- Use home runs, batting average, and RBI to predict salary
- Variables are defined as follows:
- salary=homeruns×10,000+ϵ
- BA=homeruns+270+ϵ
- RBI=homeruns×3+ϵ
- Example: homeruns=30, BA=300, RBI=90, salary=300,000
- Fit a model for each variable individually:
- salary=9,934.27×HR
- salary=1,002.95×BA
- salary=3,291.02×RBI
- Fit a model with all three: salary=9,226.169×HR+225.884×RBI+2.982×BA
- What is this model saying? Why not: salary=9,934.27×HR+3,291.02×RBI+1,002.95×BA
Helpful resource
- Omitted variable bias and multicollinearity discussion: https://are.berkeley.edu/courses/EEP118/current/handouts/OVB%20versus%20Multicollinearity_eep118_sp15.pdf
| Situation | Action |
|---|---|
| z is correlated with both x and y | Probably best to include z but be wary of multicollinearity |
| z is correlated with x but not y | Do not include z — no benefit |
| z is correlated with y but not x | Include z — new explanatory power |
| z is correlated with neither x nor y | Should not be much effect when including, but could affect hypothesis testing — no real benefit |
Hypothesis testing
Hypothesis testing
- The previous example demonstrates why we must use F test to test all hypothesis simultaneously rather than a T test
- Recall the T test for H0→^β1=θ:(^β1−θ)SE(^β1)
- The above statistic is t-distributed under the null hypothesis, so we can see how likely it would be to get the above value from a t distribution
- If we are testing multiple hypotheses, we can apply the same logic as long as we know how that statistic is distributed. In this new test, our statistic belongs to the F distribution

Back to baseball
- To perform an F test, we compare a model with restrictions to a model without restrictions and see if there is a significant difference. Think of restrictions as features not included in the model
- salary=years+gmsYear+HR+RBI+BA
- If HR, RBI, BA all have no effect on salary, then the model salary=years+gmsYears should perform just as well
- How do we measure performance? Sum of squared residuals (SSR)!
- Test statistics: SSRr−SSRur/qSSRur/(n−k−1)
- The above fraction is the ratio of two chi squared variables divided by their degrees of freedom, which makes this F-distributed
- Remember adding variables can only improve the model, so the F statistic will always be positive
Types of variables and transformations
Affine
Affine transformations are transformations that do not affect the fit of the model. The most common example is scaling transformations
Example:
- weight(lbs)=5+2.4×height(inches)
- weight(lbs)=5+0.094×height(mm)
This is why scaling variables is not necessary for linear regression, but knowing the scale of your variables is important for interpretation
Polynomial
- Linear regression can still be used to fit data with a non-linear distribution
- The model is linear in parameters, not necessarily variables
- i.e. we must have β1, β2, β3, but we can utilize x21 or x2/x3
- We might leverage the above to generate a curved regression line, providing a better fit in some cases
- How do we now interpret the coefficients?
^wage=3.12+.447exp−0.007exp2
- The big difference is the effect of an increase in experience on wage now depends on the level of experience
Logarithmic
Recall that the natural logarithm is the inverse of the exponential function, so ln(ex)=x, and:
ln(1)=0
ln(0)=−∞
ln(ax)=ln(a)+ln(x)
ln(xa)=aln(x)
ln(1x)=−ln(x)
ln(xa)=ln(x)−ln(a)
dln(x)dx=1x
Interpreting log variables
- β0=5, β1=0.2
Level-log: y=5+0.2ln(x)
- 1% change in x=β1/100 change in y
- 1% change in x=β1/100 change in y
Log-level: ln(y)=5+0.2(x)
- 1 unit change in x=β1×100% change in y
- 1 unit change in x=β1×100% change in y
Log-log: ln(y)=5+0.2ln(x)
- 1% change in x=β1% change in y
- 1% change in x=β1% change in y
Dummy variables
- Dummy variables is how categorical variables can be mathematically represented
- They represent groups or place continuous variables into bins
- What is this regression telling us?
- nbaSalary=5×PPG+10.5×guard+9.6×forward+10.8×center
- nbaSalary=5×PPG+10.5×guard+9.6×forward+10.8×center
- Do we need dummy variables for guard, forward, center?
- How would the regression change if we only used 2 out of 3?
- nbaSalary=10.5+5×PPG−0.9×forward+0.3×center